
ESP32: Does Module Placement Matter?
Introduction
At the Laboratory, we have worked on a range of projects using wireless modules, including different ESP32 variants and Nordic’s nRF52840. We usually follow the manufacturers’ design guidelines, which typically recommend placing a module near the edge of the board and leaving a clear area around the antenna to optimize its performance. However, we have seen projects ignore these guidelines more than once, which made us wonder how much of this guidance is a recommendation and how much is a requirement.
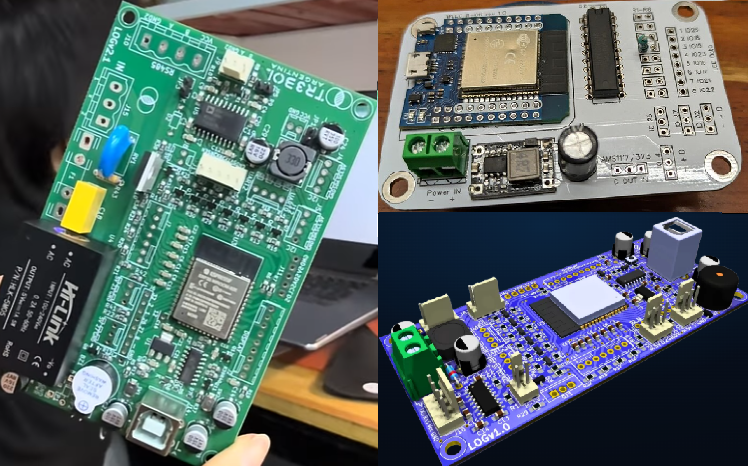
Espressif explains how to position a module with a PCB antenna in its Hardware Design Guidelines.
Still, we wanted to find out how much the signal from an ESP32 with an on-board antenna changes depending on where it is placed. Would the difference be just a few decibels, or could it make communication impossible?
The Experiment
To run a series of experiments, we built a test base: a single-sided PCB placed on top of another board to simulate a double-sided PCB with a continuous ground plane. It had six possible mounting positions for the same physical module. We did not use six different modules; we repeatedly moved the same one, holding it in place with soldered pins that provided both mechanical support and an electrical connection to the ground plane. For the center position, we removed the copper from the area that would be the antenna keepout beneath the antenna, as the manufacturer recommends. This area is usually defined in the module footprint, so that particular recommendation is followed even when the placement recommendation is not.
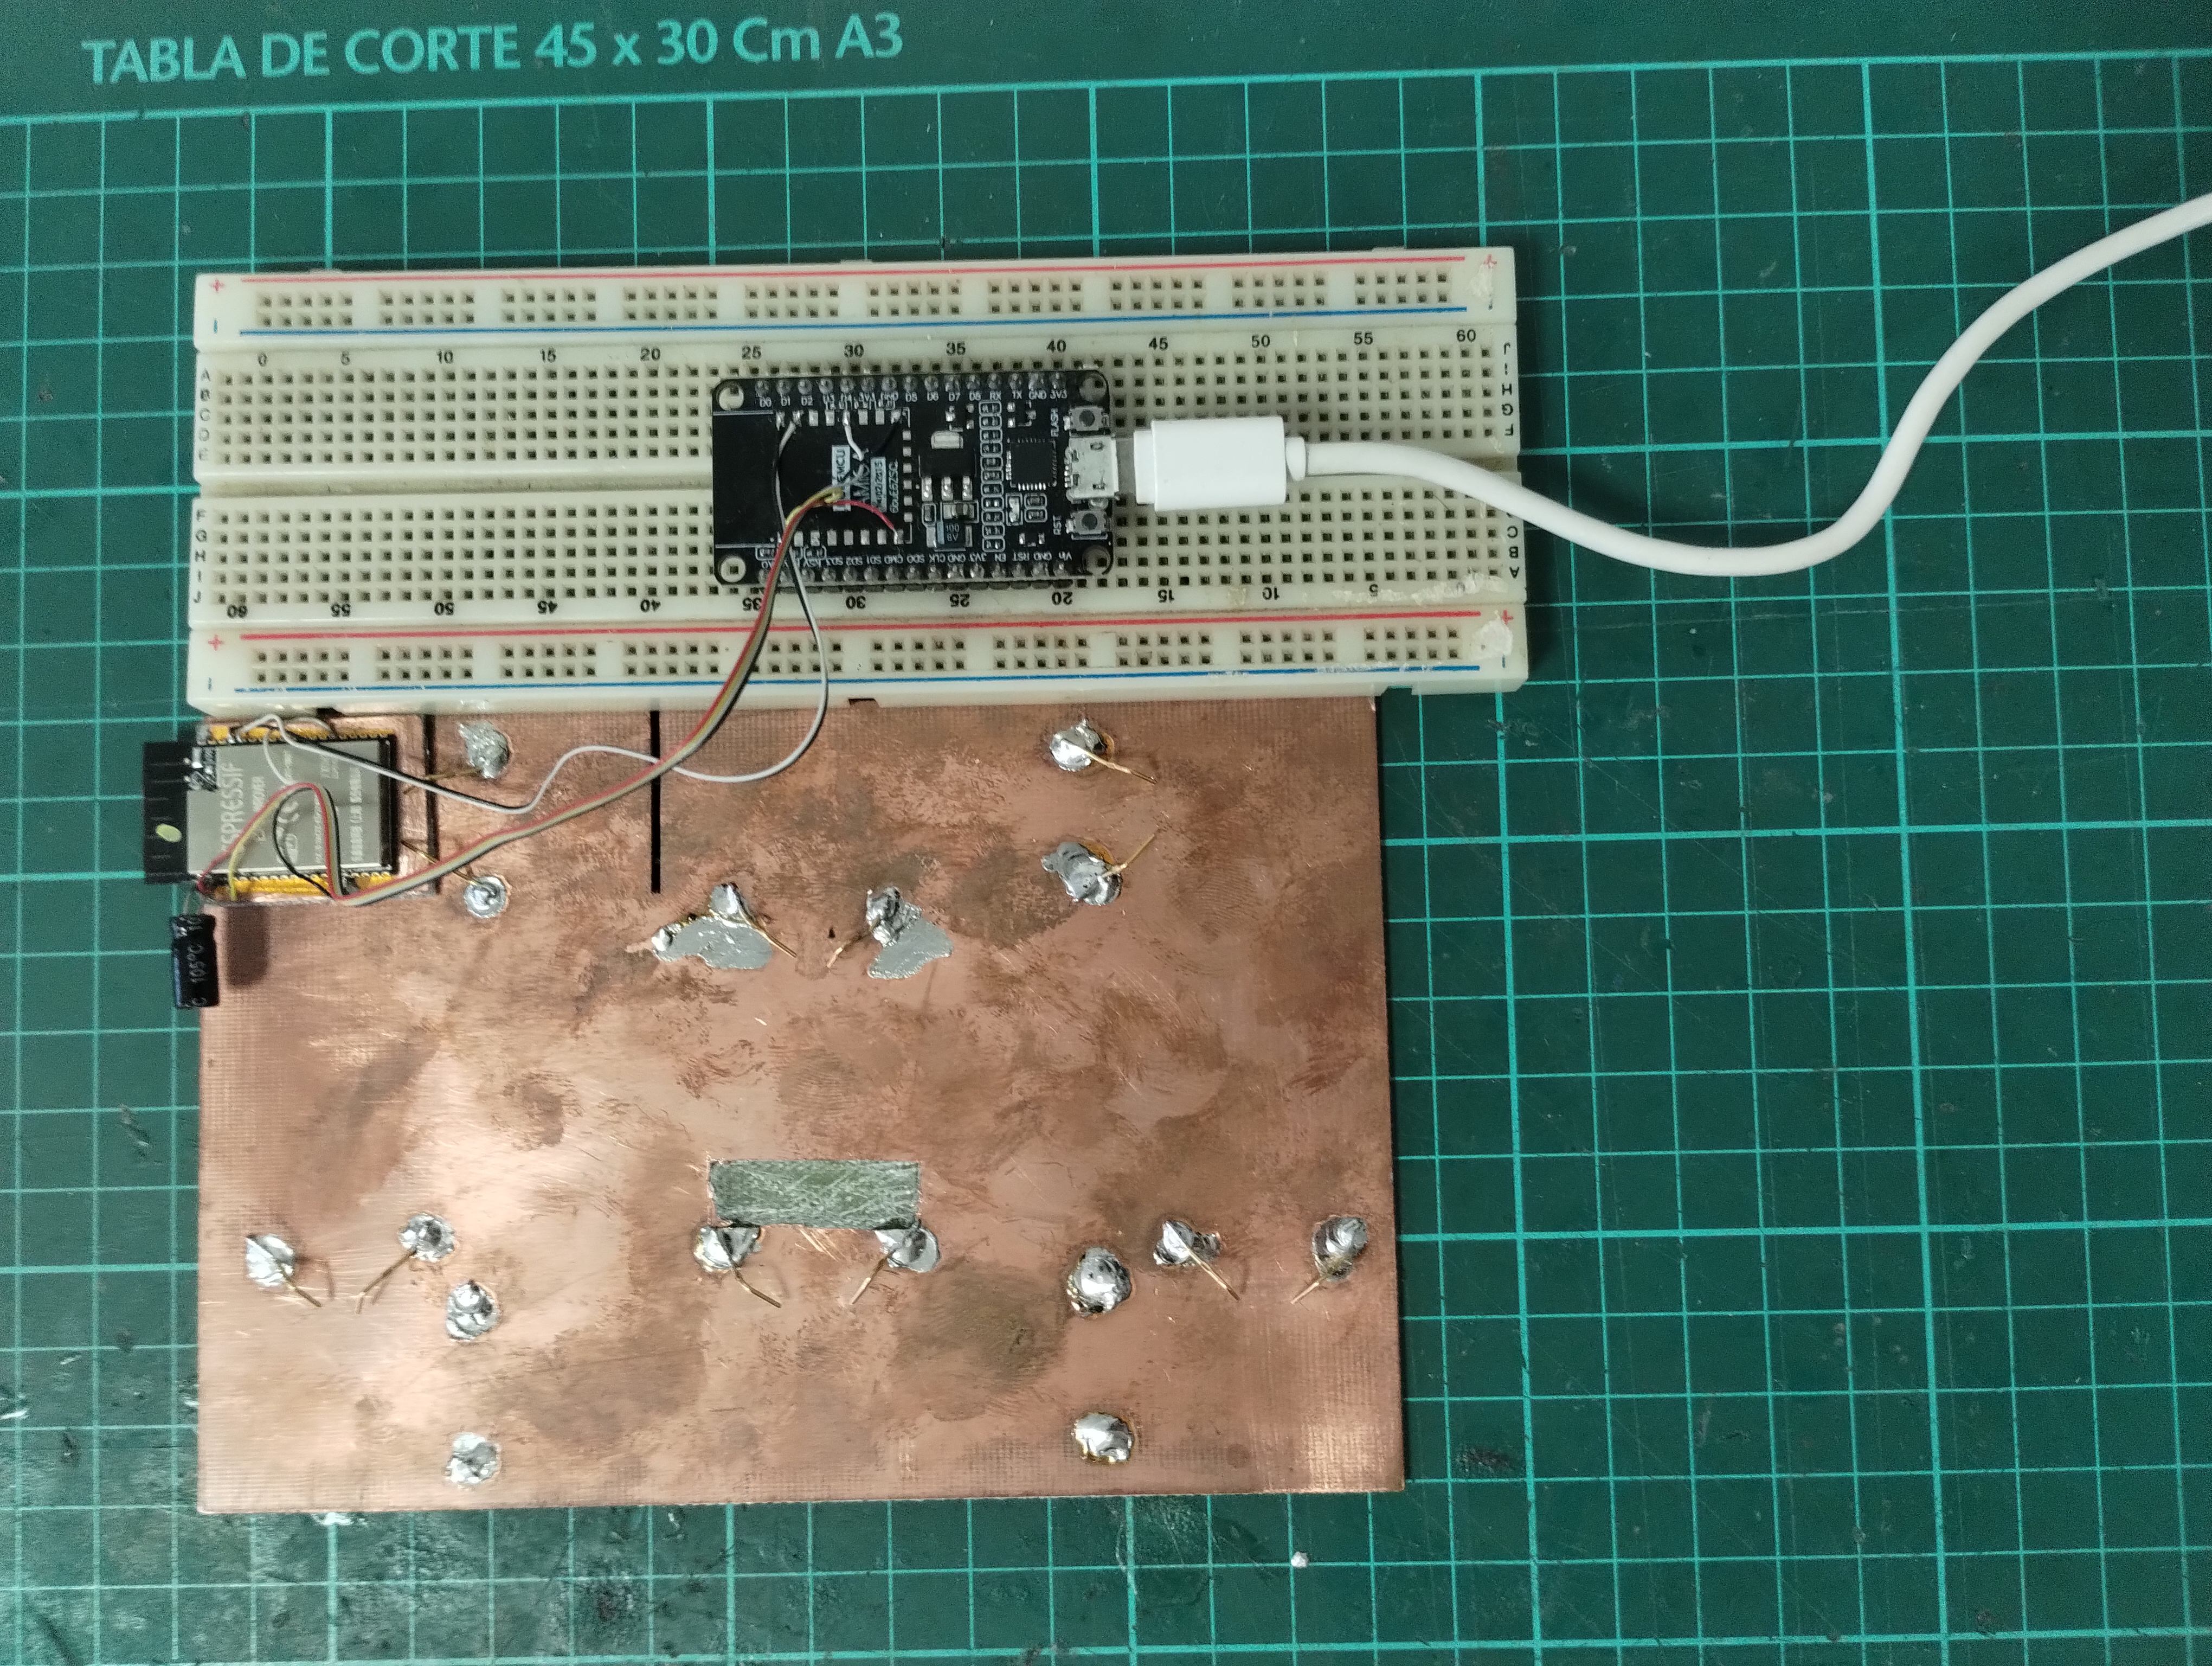
The board connects to a laptop running an app that sends commands over a serial port to configure experiments and collect data.
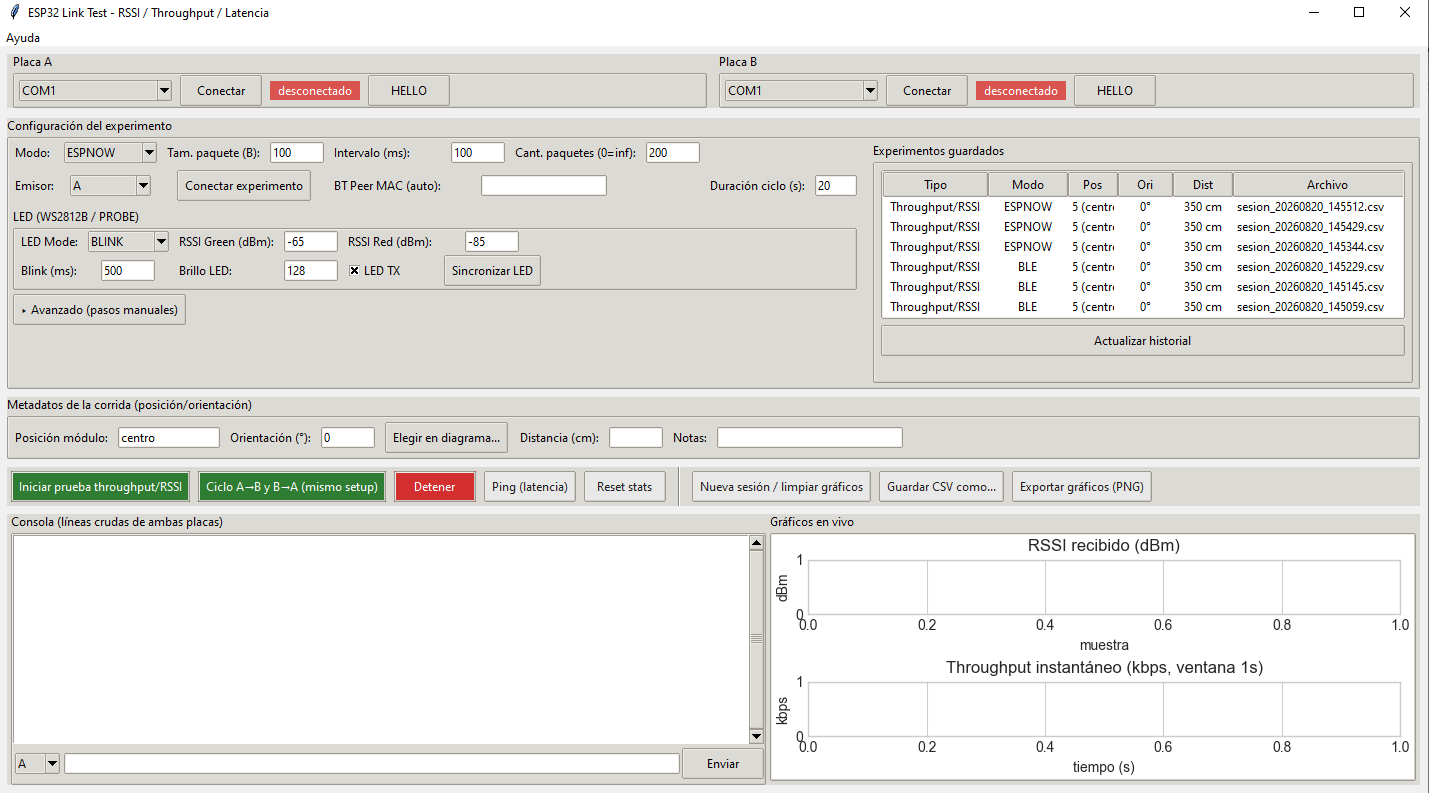
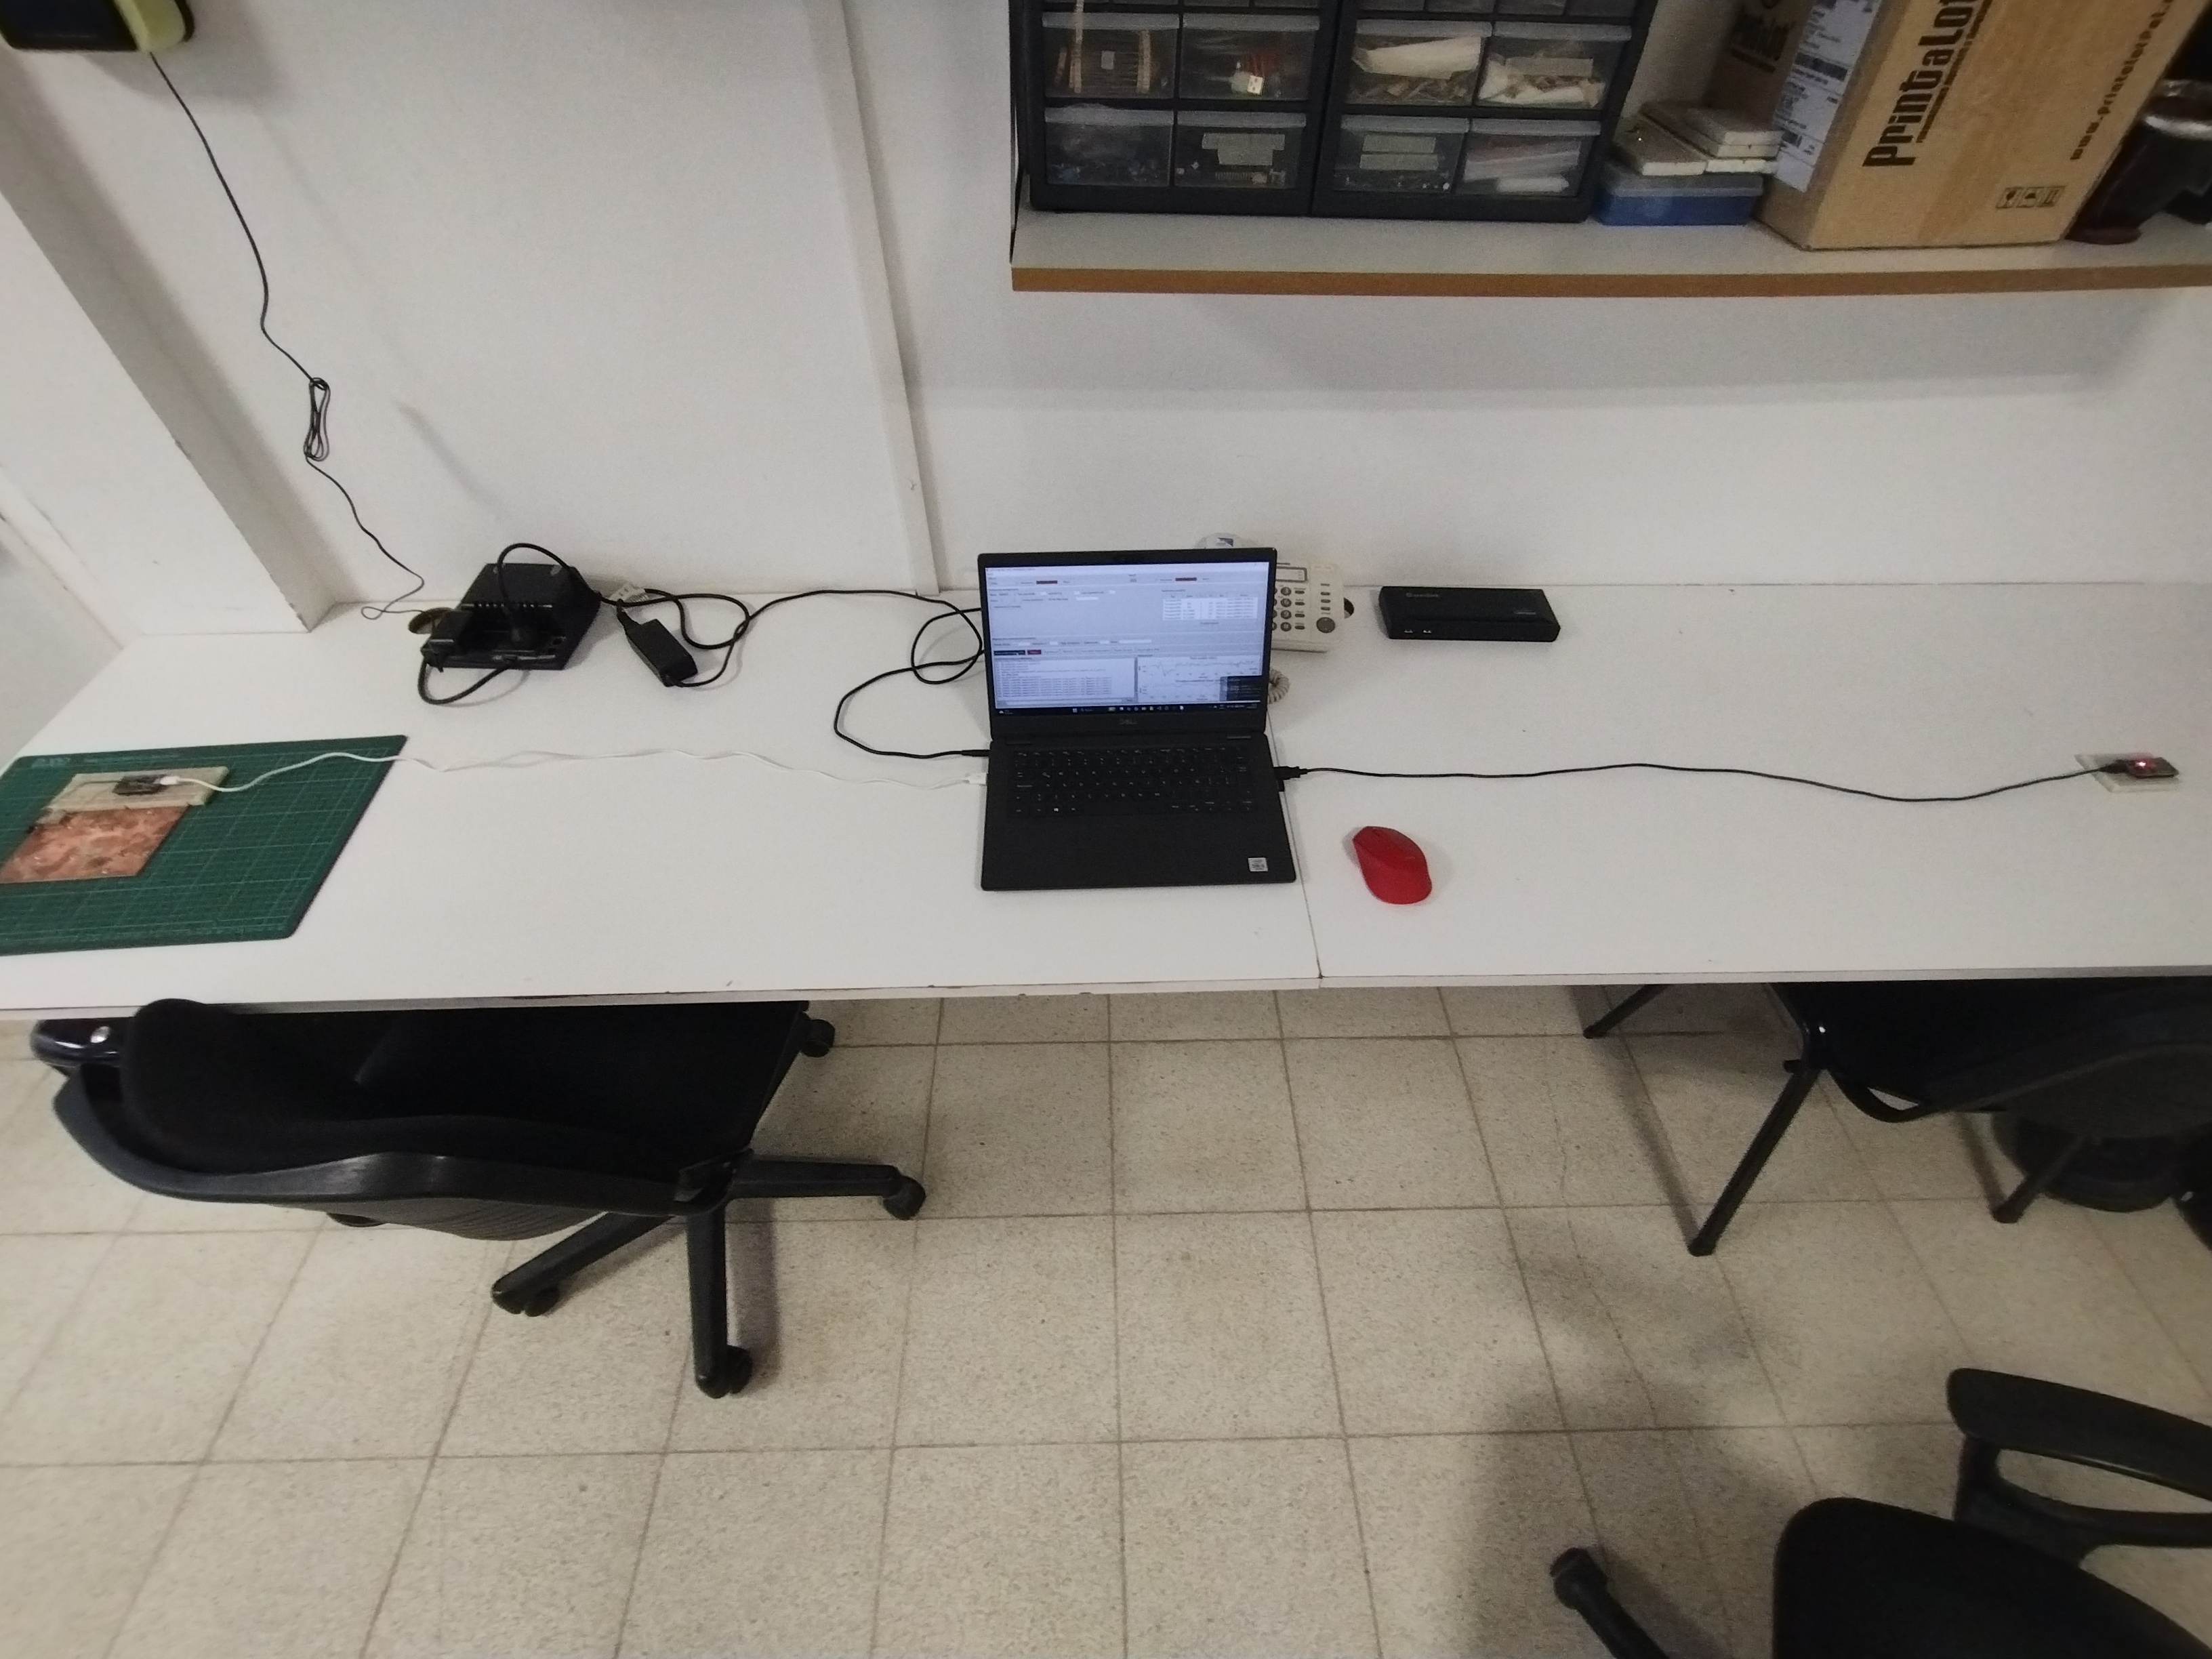
The app also communicates with a second ESP32 board that remains fixed in one position. We measured RSSI and throughput using three different protocols (ESP-NOW, BLE, and Bluetooth Classic), initially sending batches of 200 100-byte packets every 100 ms per run, for a low input rate of 8 kbps that would not saturate the receiving link. In total, we collected 70 sessions and about 800 RSSI samples per position and protocol.
Result 1: Footprint Position Matters, A Lot
The results table makes it quite clear:
| Protocol | Best position | Worst position | Gap (best − worst) |
|---|---|---|---|
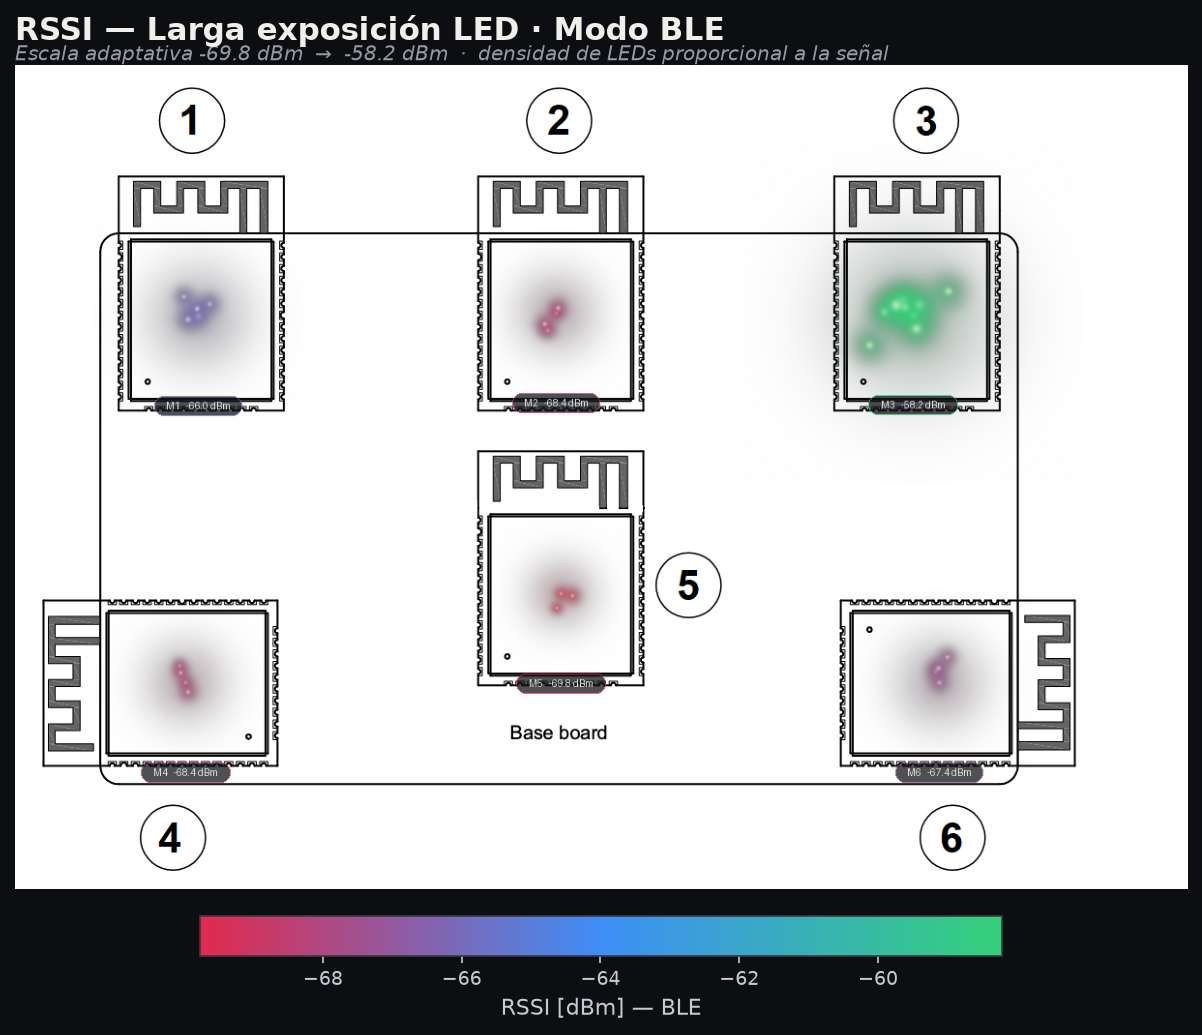
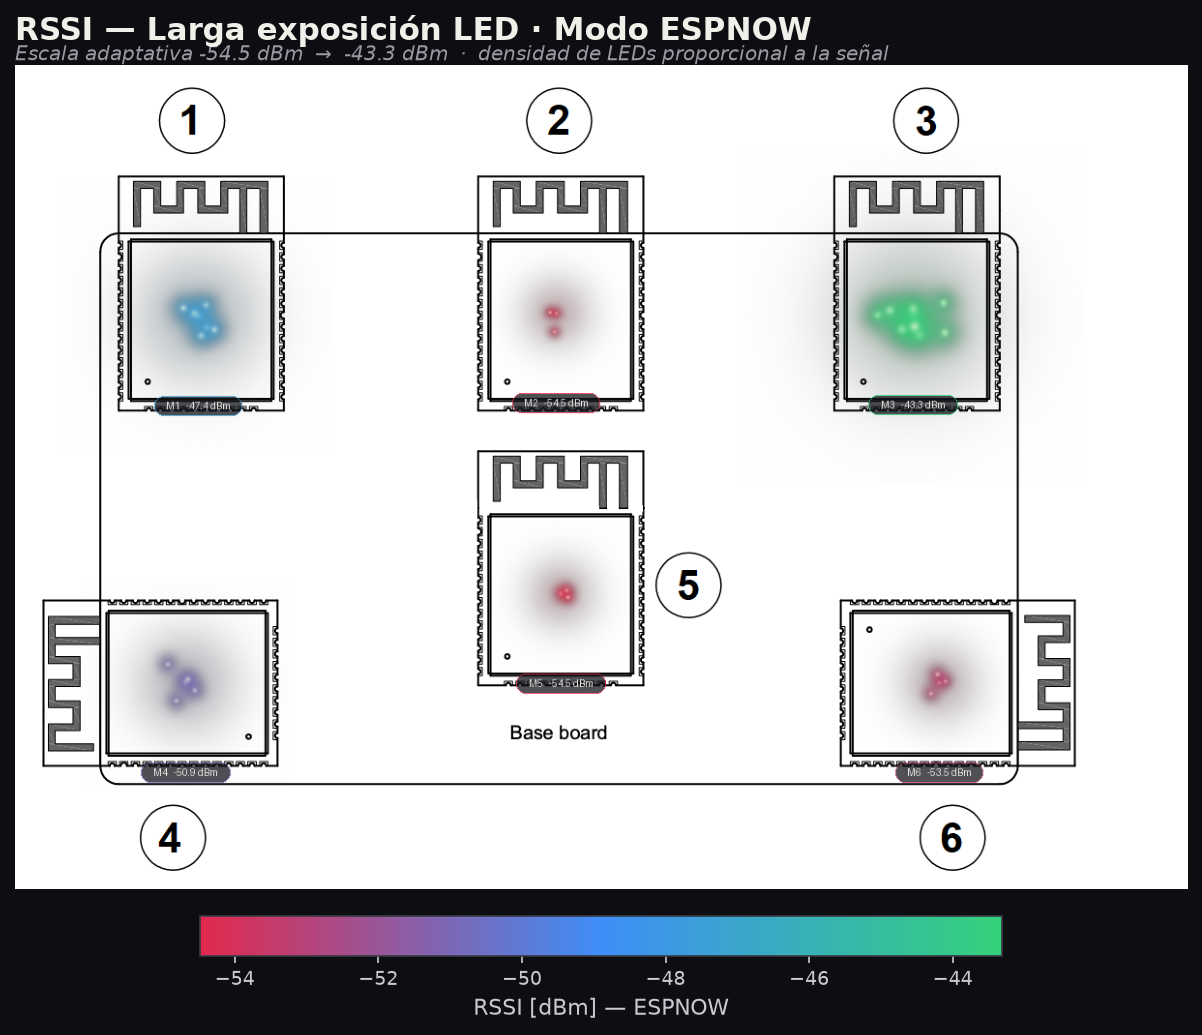
| ESP-NOW | 3 (-43.31 dBm) | 5, center (-54.48 dBm) | 11.17 dB |
| BLE | 3 (-58.21 dBm) | 5, center (-69.77 dBm) | 11.56 dB |
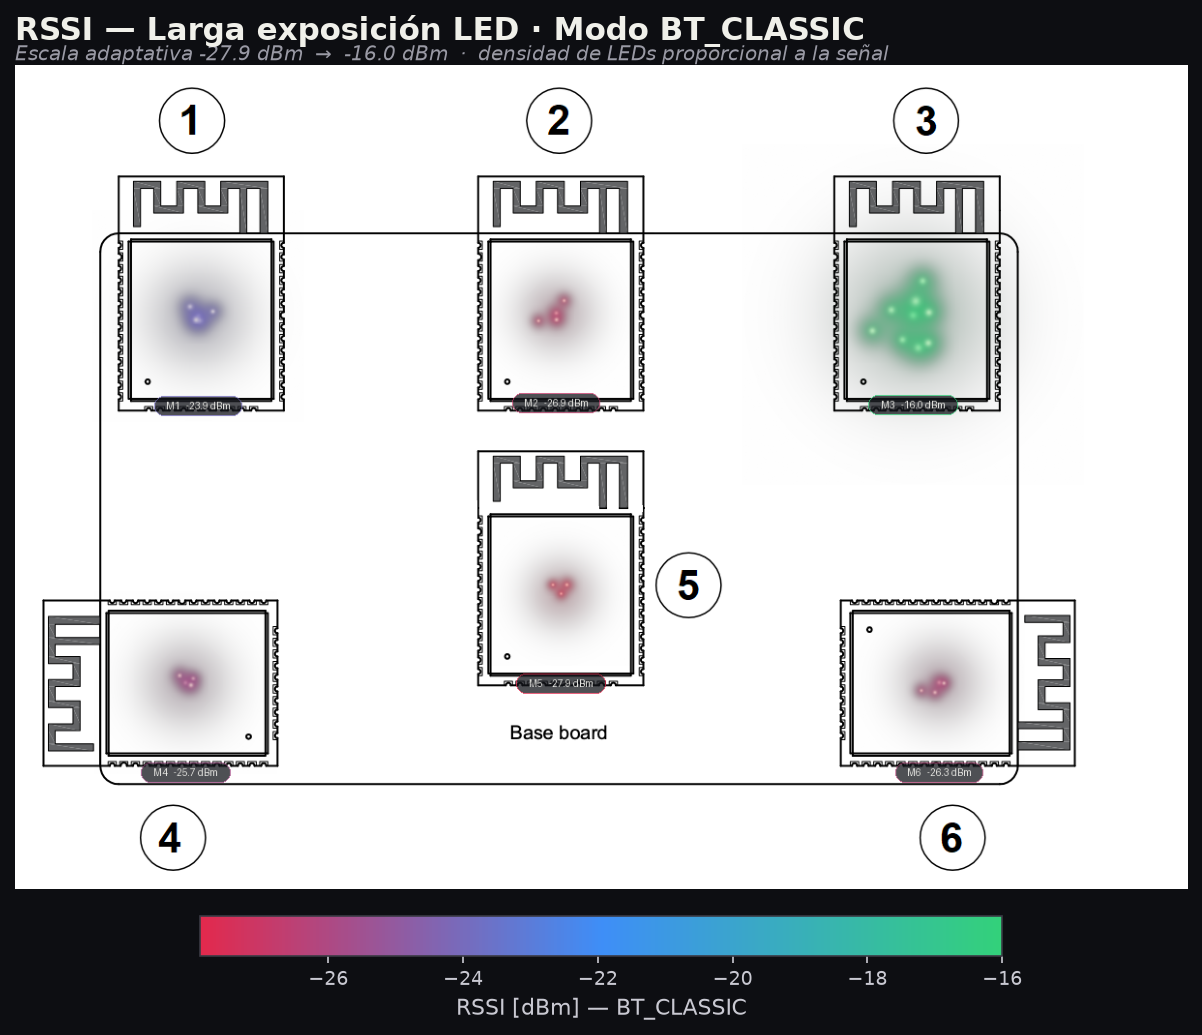
| Bluetooth Classic | 3 (-16.00, relative scale) | 5, center (-27.90) | 11.90 dB |
That is an 11 to 12 dB difference just from moving the chip a few centimeters on the same board. Same module, same distance, same antenna. Losing 6 dB means receiving half the power. Here, we lost almost twice that just by choosing a poor location.
Result 2: The Ranking Is Consistent Across All Three Protocols
The best and worst locations were exactly the same for ESP-NOW, BLE, and Bluetooth Classic. Three protocols with different radio stacks operating at 2.4 GHz, and they all agreed:
| Protocol | Complete RSSI ranking (best → worst) |
|---|---|
| BLE | 3 (-58.21 dBm) > 1 (-66.01) > 6 (-67.40) > 2 (-68.38) > 4 (-68.39) > 5 (-69.77) |
| Bluetooth Classic | 3 (-16.00) > 1 (-23.95) > 4 (-25.72) > 6 (-26.33) > 2 (-26.86) > 5 (-27.90) |
| ESP-NOW | 3 (-43.31 dBm) > 1 (-47.44) > 4 (-50.86) > 6 (-53.48) > 2 (-54.45) > 5 (-54.48) |
Position 3 was the clear winner: it was best every time, across all three protocols, leading the runner-up by 4.1 to 7.9 dB. Position 1 was consistently second. Positions 4, 6, and 2 clustered in the middle, very close to one another. Position 5, in the center, was by far the worst (or tied for last in ESP-NOW).
Why Position 3 Wins and Position 5 Loses: The RF Explanation
This fits perfectly with Espressif’s guidance. The antenna needs a copper-free clearance area around it (no ground planes or nearby metal components) to avoid detuning, and the feed should point toward a free edge of the board.
Position 3 is right at a corner, pointing outward with nothing nearby to block it. Position 5 is the opposite: it is enclosed by the other positions and surrounded by copper on all four sides, a textbook example of antenna detuning caused by insufficient keepout.
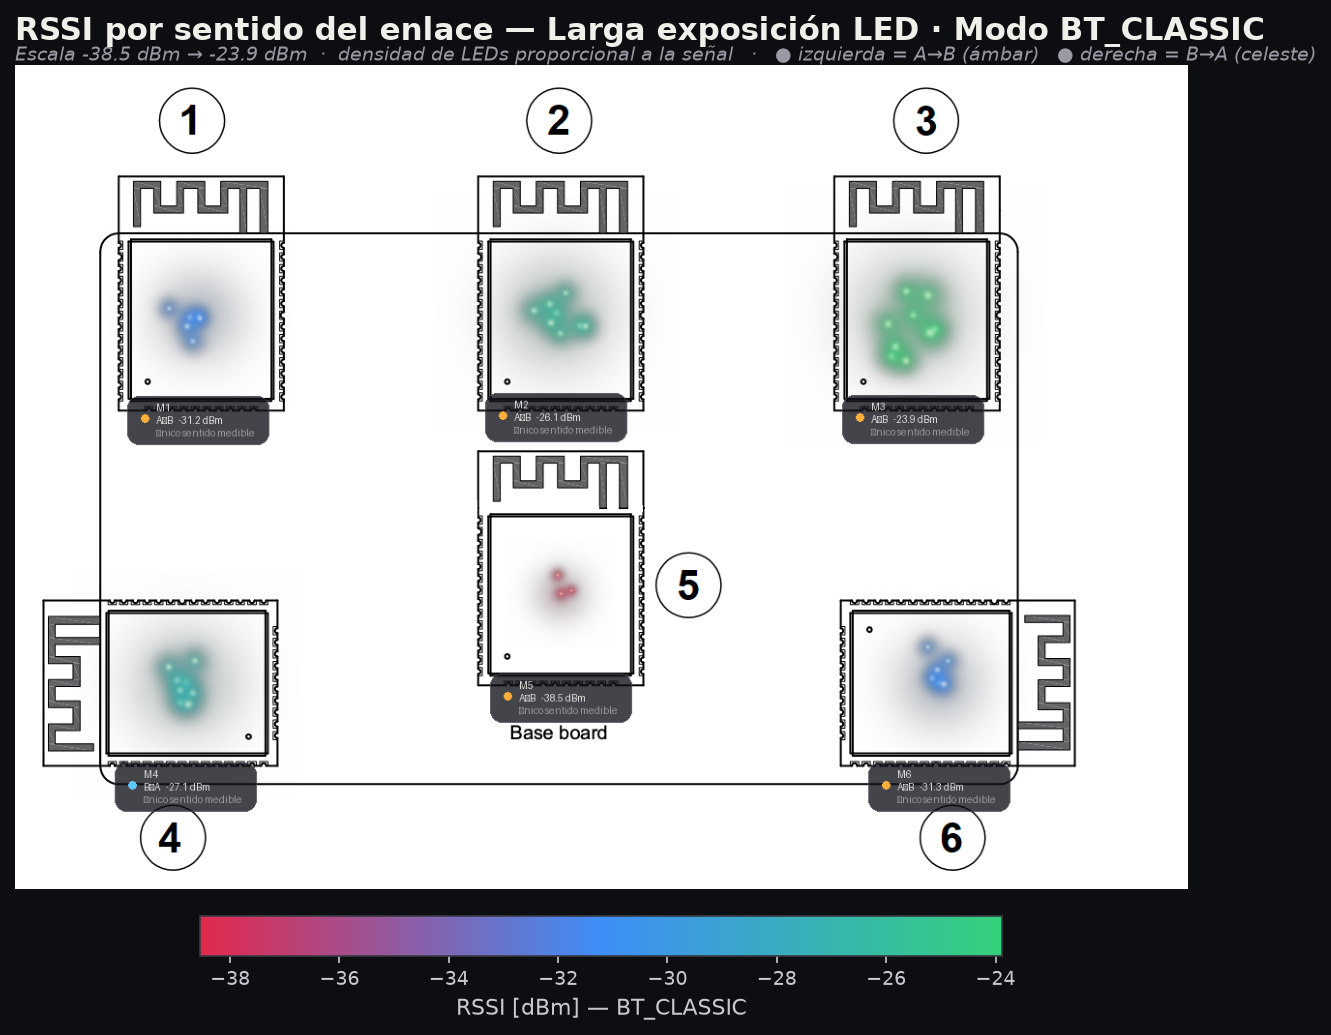
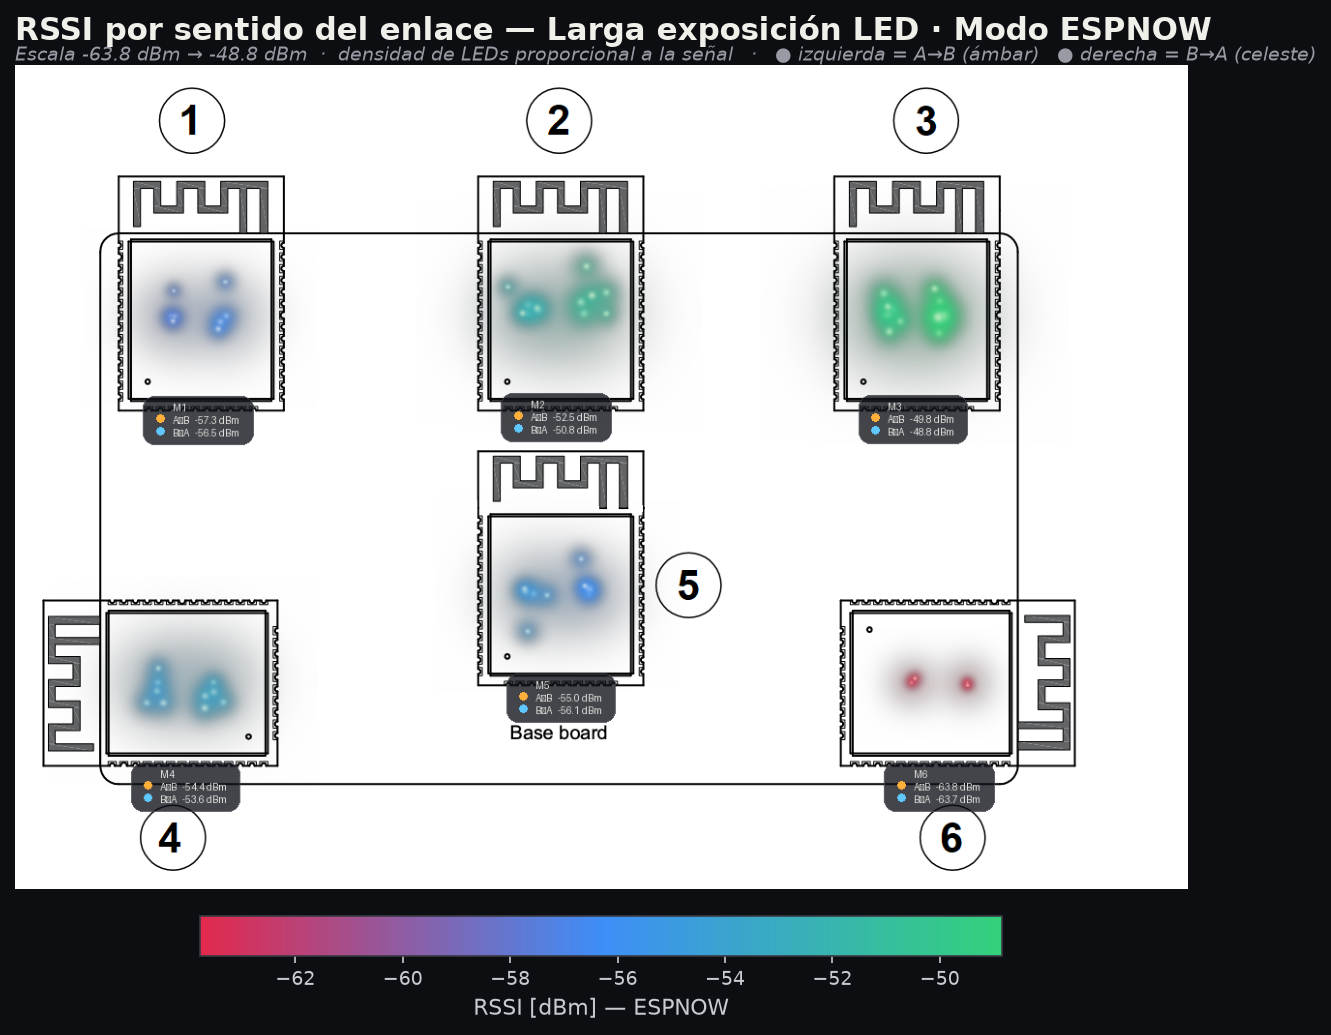
To visualize the results more intuitively than with a box plot, we wrote a script that generates “long exposure with synthetic LEDs” images: it overlays colored points of light on the board photo, one for each RSSI sample, with a soft Gaussian glow and a screen blend (light accumulates and brightens without obscuring what is underneath). The result looks more like an actual long-exposure photograph than a chart, and makes it easy to see the signal level at each position and how much it varies.
A Result That Does Not Quite Add Up: Positions 3 and 6
According to the manufacturer’s guidelines, positions 3 and 6 should both be the best: in both, the antenna extends beyond the base board and the feed point is near the edge, exactly as Espressif recommends. Position 3 always performed as expected, but position 6 did not do as well. In one run, position 4 beat position 6; in the next, the order was reversed. Positions 3 and 5 were always very stable, but position 6 showed considerable variation between repetitions.
We do not have a definitive answer yet, but we have a few hypotheses. Since we removed and repositioned the module by hand for each session, a tiny change in its resting angle may have affected the measurement. Also, at 2.4 GHz, walls and objects in the environment create reflections (multipath) that change with millimeter-scale differences in distance; the test environment may have disadvantaged that particular position.
What the Throughput Did NOT Show in the First Run
At an input rate of 8 kbps, the transfer speed was exactly the same for every position and protocol: a steady 8.00 kbps.
That does not mean module placement has no effect on speed. At this low rate, the link operates very comfortably even in the worst case: at -70 dBm, it is still nowhere near the sensitivity limit of these chips. We needed to push the test to its limit.
Second Run: Increasing the Transfer Rate
We ran a second set of tests. Same positions, same distance, same three protocols, but this time we pushed the network with larger packets and tighter timing. We brought ESP-NOW to about 160 kbps, BLE to 200 kbps, and Bluetooth Classic to 410 kbps (20 to 50 times faster than before).
RSSI again showed the same marked difference:
| Protocol | Best position | Worst position | Gap (best − worst) |
|---|---|---|---|
| ESP-NOW | 3 (-40.7 dBm) | 1 (-53.7 dBm) | 13.0 dB |
| BLE | 3 (-58.6 dBm) | 5, center (-72.0 dBm) | 13.4 dB |
| Bluetooth Classic | 3 (-16.0, relative) | 4 (-30.8) | 14.8 dB |
The ranking shifted a little. Position 6 moved up:
| Protocol | Ranking (best → worst) |
|---|---|
| ESP-NOW | 3 > 6 > 5 (center) > 2 > 4 > 1 |
| BLE | 3 > 6 > 2 > 1 > 4 > 5 (center) |
| Bluetooth Classic | 3 > 6 > 1 > 2 > 5 (center) > 4 |
Position 3 was once again the clear winner, leading in both runs and every measurement. Position 6 came second in all three protocols, which was not as clear in the first run and now agrees with Espressif’s recommendation (feed facing outward). The other middle positions shifted somewhat; differences in that middle group are small and very sensitive to the environment.
And the most curious result of the second run: despite pushing the network hard, throughput barely noticed. We saw isolated performance drops during bursts of lost packets, but they were scattered equally across all positions. The signal has to degrade much further for throughput to drop systematically. RSSI exposes poor module placement long before you notice it in the transfer speed.
Transmitter/Receiver Swap: Bidirectional Link (A → B vs. B → A)
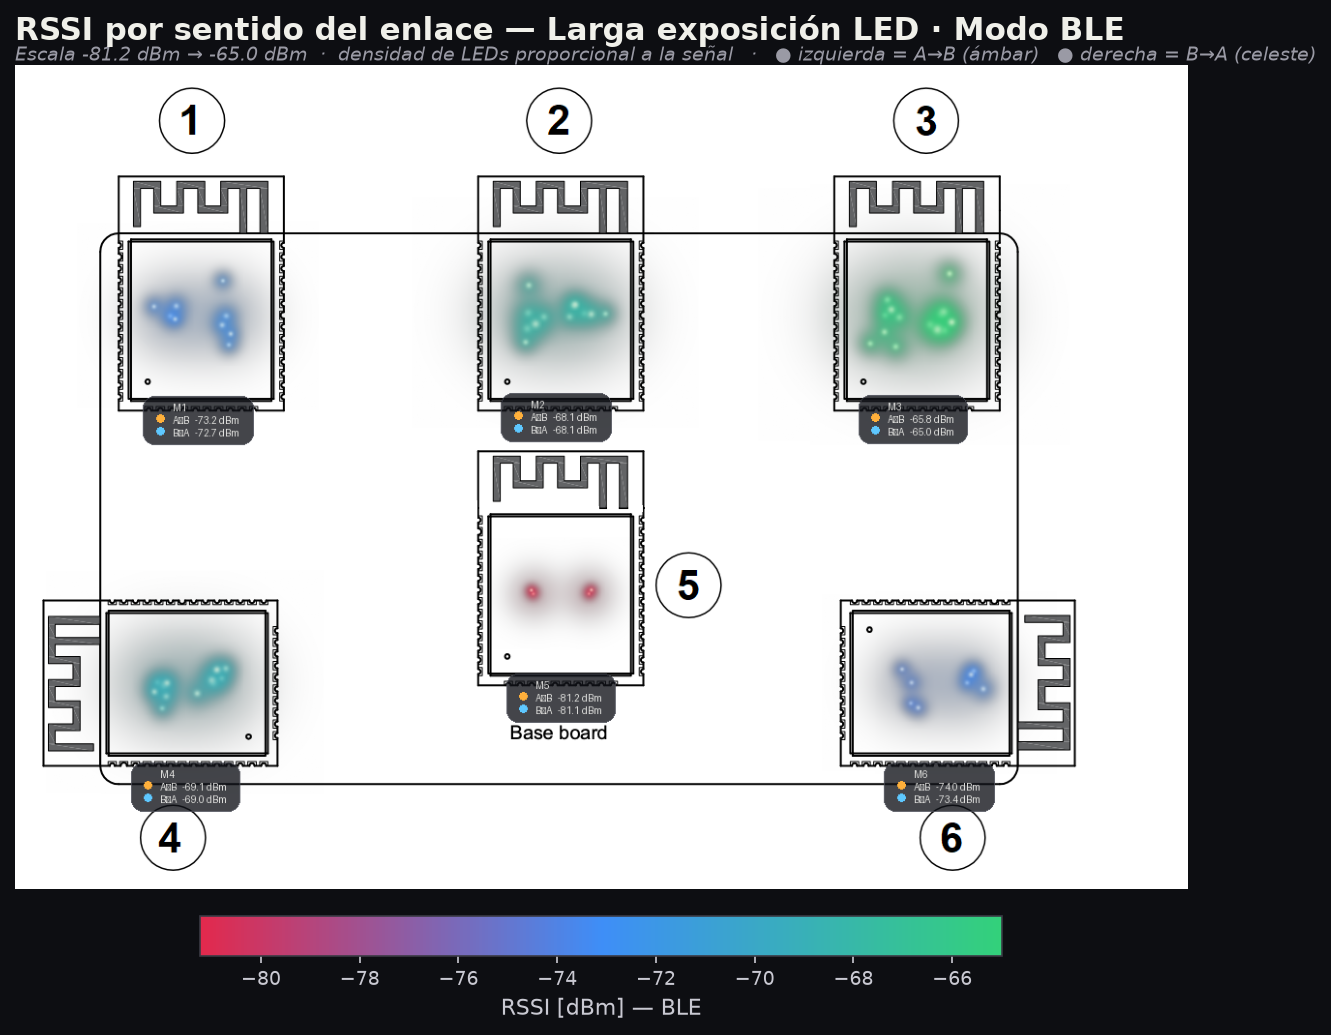
For this third round, we increased the distance between the boards to 350 cm (up from 230 cm) and swapped transmitter and receiver halfway through each test. We wanted to see whether the outbound link (A → B) and return link (B → A) produced symmetric RSSI and throughput, or whether link direction introduced a difference.
Position Ranking at 350 cm
At the greater distance, the gap between the best and worst positions remained wide (between 14.4 and 15.8 dB):
| Protocol | Best position | Worst position | Gap (best − worst) |
|---|---|---|---|
| ESP-NOW | 3 (-49.33 dBm) | 6 (-63.74 dBm) | 14.41 dB |
| BLE | 3 (-65.40 dBm) | 5, center (-81.17 dBm) | 15.78 dB |
| Bluetooth Classic | 3 (-23.88, relative) | 5, center (-38.54) | 14.66 dB |
The ranking shifted a little compared with the previous runs:
| Protocol | Complete RSSI ranking (best → worst) |
|---|---|
| BLE | 3 (-65.40 dBm) > 2 (-68.08) > 4 (-69.07) > 1 (-72.96) > 6 (-73.72) > 5 (-81.17) |
| Bluetooth Classic | 3 (-23.88) > 2 (-26.10) > 4 (-27.08) > 1 (-31.22) > 6 (-31.26) > 5 (-38.54) |
| ESP-NOW | 3 (-49.33 dBm) > 2 (-51.67) > 4 (-53.99) > 5 (-55.55) > 1 (-56.89) > 6 (-63.74) |
Position 3 was again first in every case. This time position 2 moved up to second place and position 4 to third, with similar results across all three modes. Position 5 (center) remained last in BLE and Bluetooth Classic, dropping to -81 dBm in BLE. In ESP-NOW, position 6 fell to last place, probably because that orientation is more affected at 3.5 meters.
Throughput and Link Symmetry
Throughput was nearly identical in both directions (A → B vs. B → A):
- BLE: 7.80 kbps in A → B vs. 7.91 kbps in B → A (p = 0.2494, not significant).
- Bluetooth Classic: 7.87 kbps in A → B vs. 7.89 kbps in B → A (p = 0.7621, not significant).
- ESP-NOW: 7.84 kbps in A → B vs. 7.89 kbps in B → A (p = 0.5612, not significant).
Link direction can introduce small RSSI asymmetries, on the order of 0.3 to 1.7 dB, probably due to minor differences in sensitivity or transmission power between the two specific modules we used. But throughput is unaffected, and module placement on the PCB remains what really matters.
Near-Field Visualization
The synthetic visualizations were useful, but they made us want to try the real thing: mount a physical WS2812B LED on the board, move it through space in a dark room, and capture its path with a camera. We did—or at least tried.
At first, we tried moving the board with the LED by hand over the test board. We could see color changes, but the path was not very even, so no clean pattern emerged.
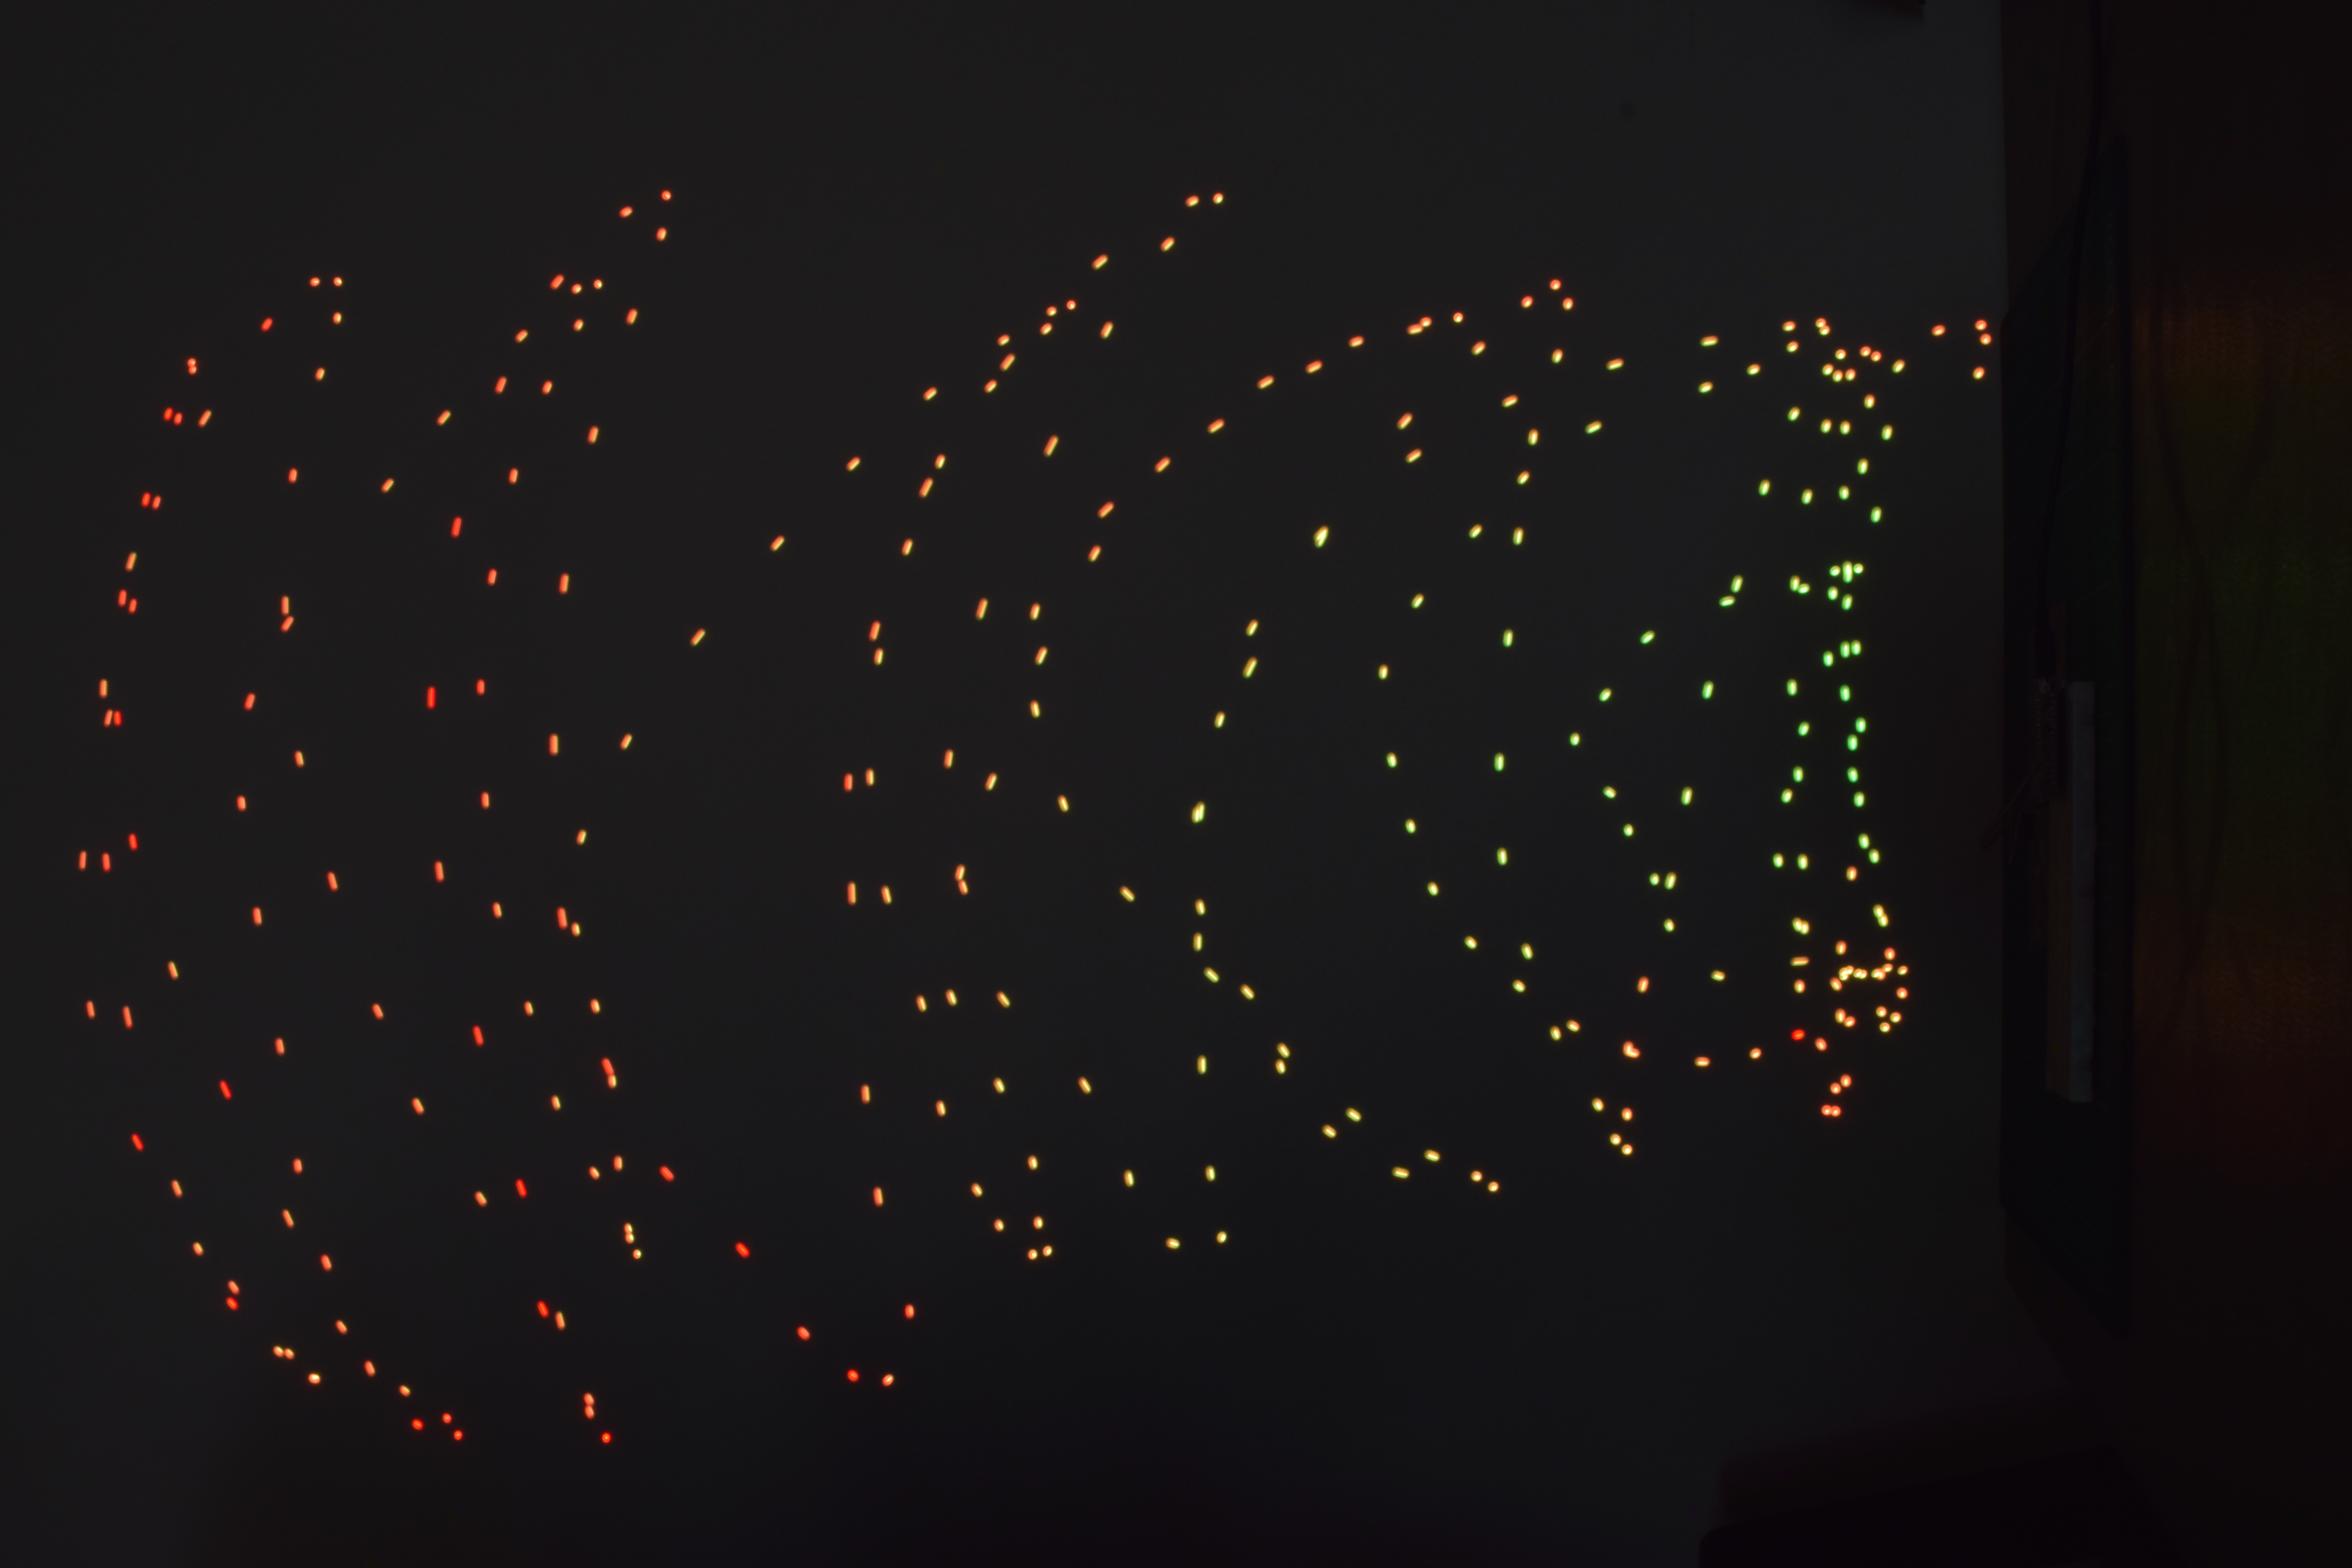

We then used a 3D printer (an Artillery Sidewinder X1). A Python script generated G-code for a systematic path in the XZ plane. We mounted the board on the extruder and let the machine sweep the module through different positions. The results:
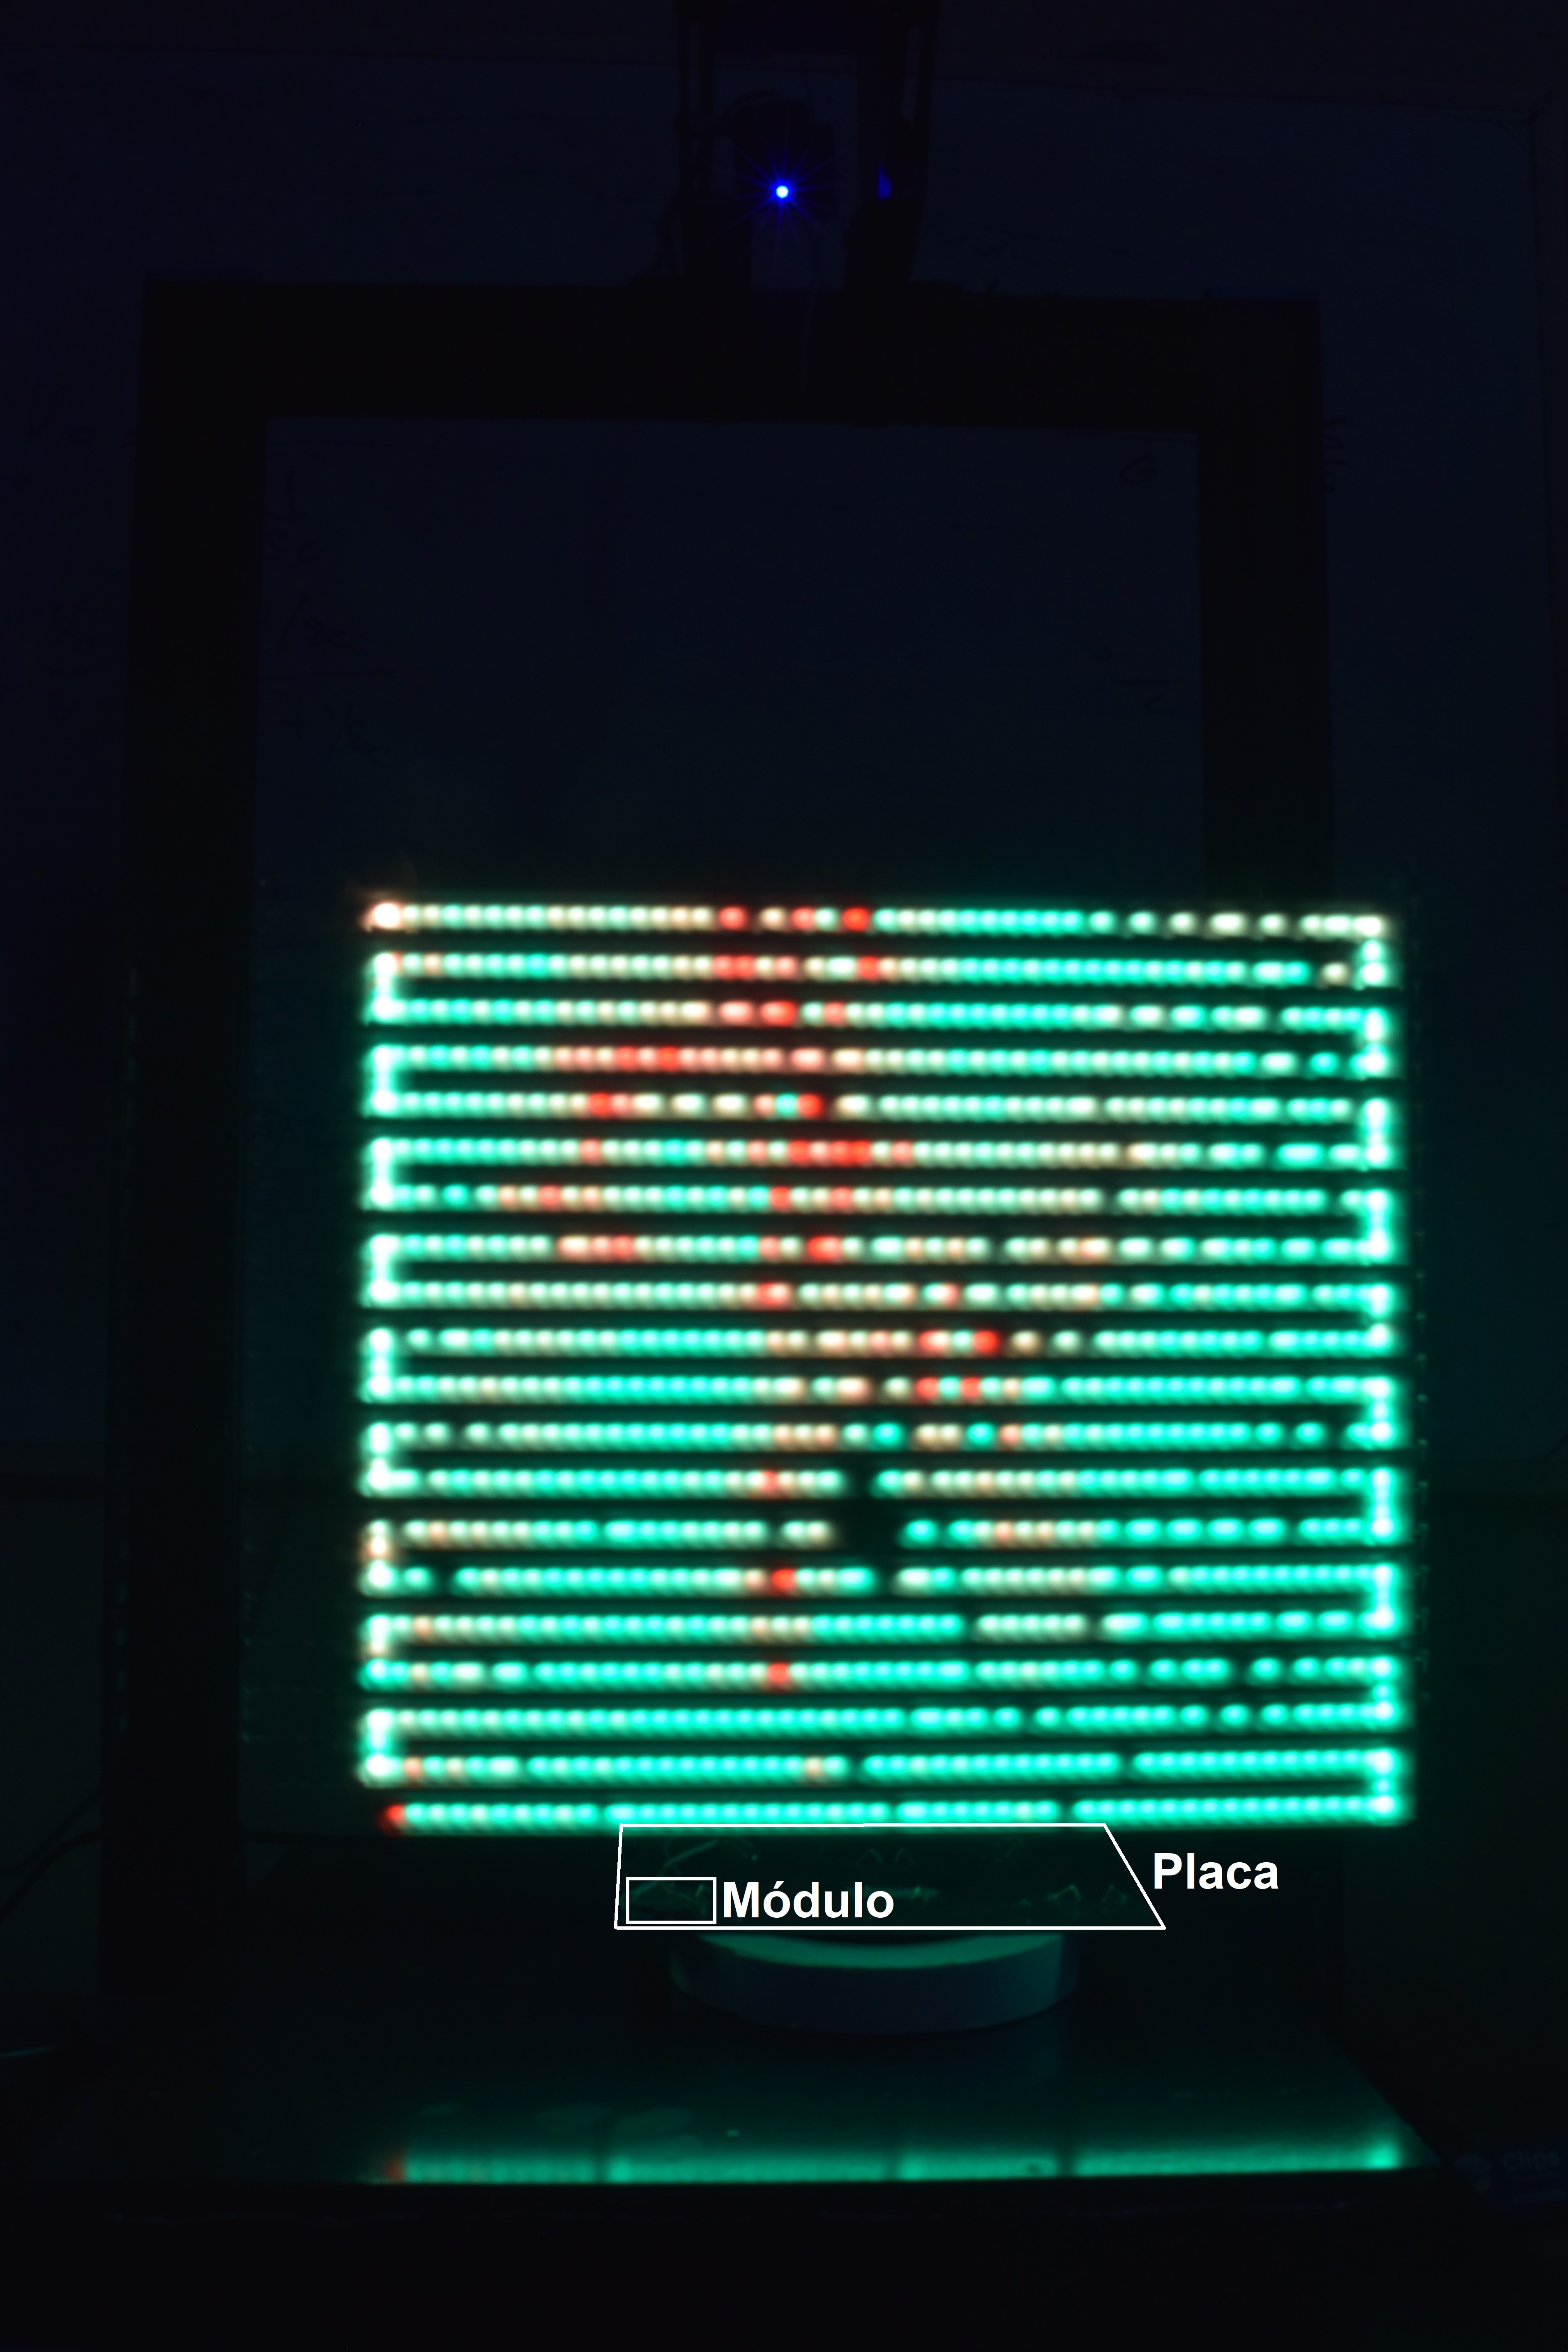
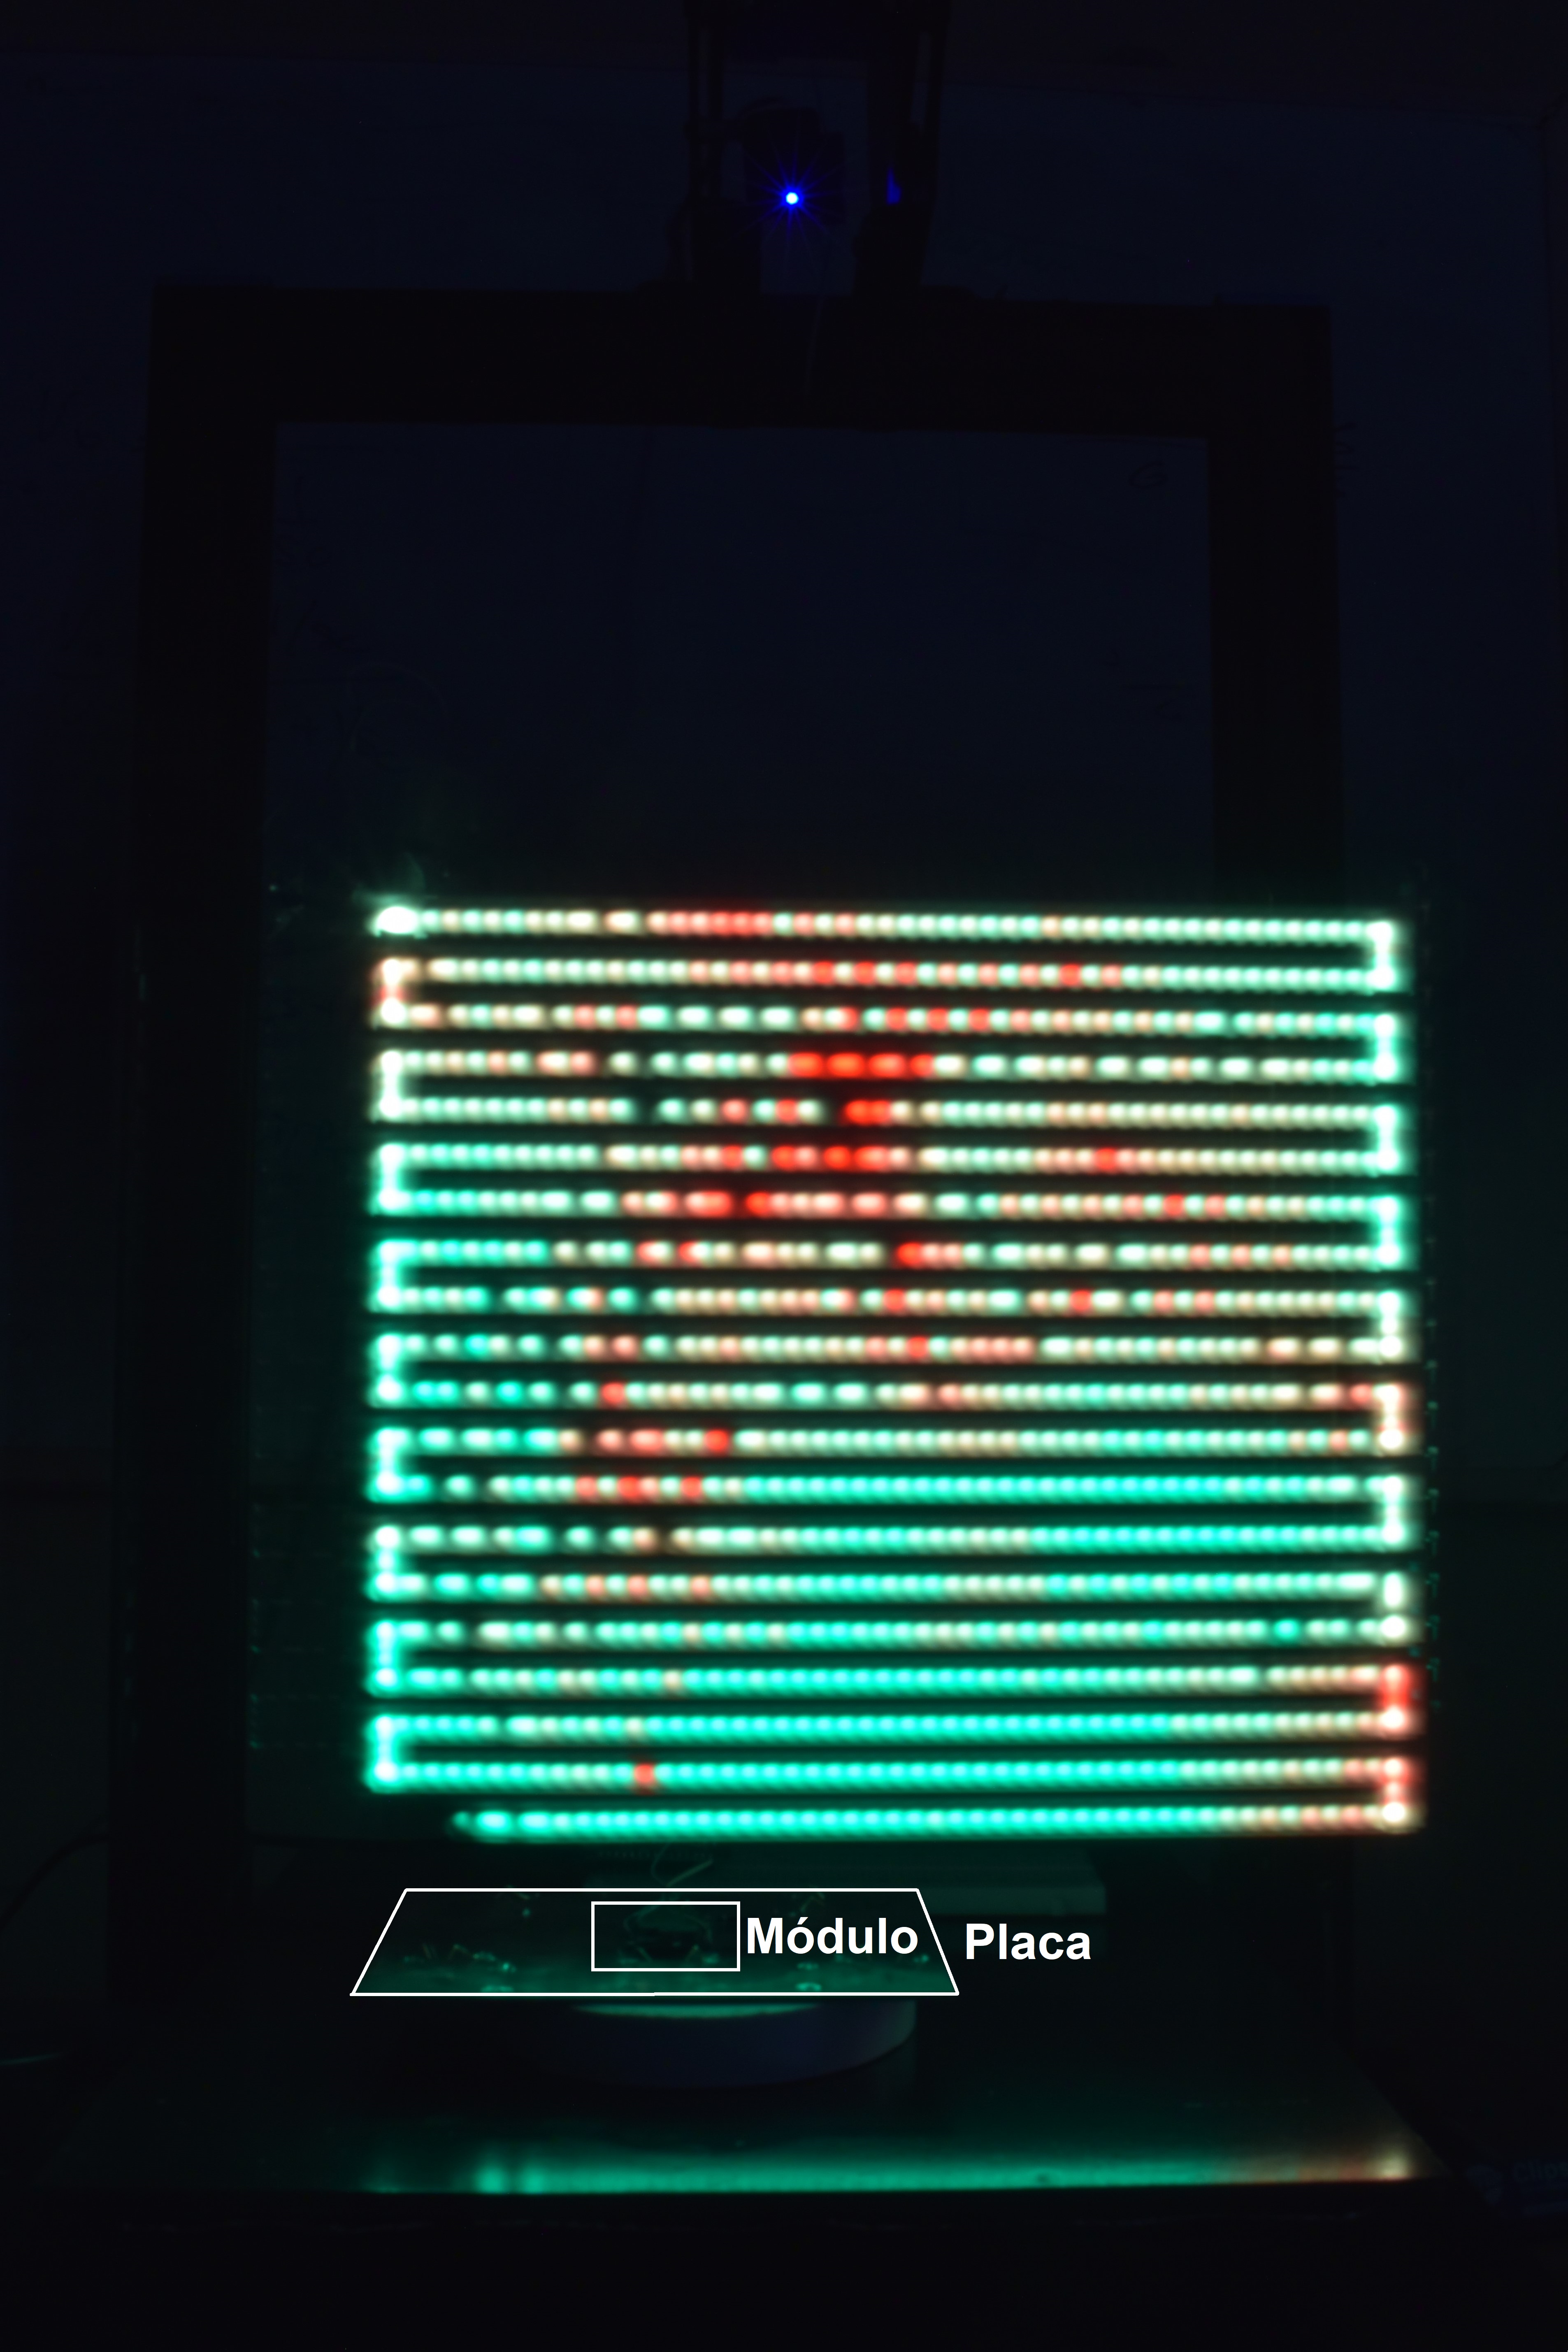
There is significantly more “red” at position 5, indicating poor signal reception.
PCB Design Takeaways
Moving the module a few centimeters on the same board changes RSSI by 11 to 15 dB. Not all corners are equal.
Surrounding the antenna with a ground plane is the worst thing you can do. The module in the center, surrounded by copper, produced the worst results in almost every test. Pointing the feed toward a free edge is the safe approach: position 3 (corner with a clear path outward) won all six tests, and position 6 (same principle: antenna outside the board and feed point at the edge) also performed very well in the fast run. The manufacturer’s theory holds up.
That said, losing 11 dB is not the same as losing the connection. In every test, even position 5 (the worst) kept the link active, and throughput did not collapse until we forced very high rates. If a device operates over short distances, in an environment with good propagation, or with a generous link budget, a suboptimal location may be perfectly acceptable. The problem arises when the signal budget is tight: greater distance, walls, interference, or low-power modules. In those situations, the 11 dB “given away” by poor placement can be the difference between a stable link and one that drops out.
If you only measure transfer speed, you will not notice any difference at short range, even when the signal is 12 dB lower. RSSI is the only metric that immediately tells you whether the location is poor. And watch out for the middle positions: the first and last places were clear, but the ones in the middle shifted somewhat from test to test. If you are making a design decision based on a middle position, measure it a couple more times.
Note on Bluetooth Classic RSSI: in this mode, the firmware does not read an absolute RSSI value in dBm as it does with Wi-Fi/ESP-NOW or BLE. The ESP32 Bluetooth Classic controller only exposes esp_bt_gap_read_rssi_delta(), which returns a value relative to the “Golden Receive Power Range”—the power range the chip itself considers ideal for its internal power-control algorithm. A value of 0 means “the signal is within the ideal range,” a negative value means “weaker than ideal,” and a positive value means “stronger than ideal.” It is not an absolute power measurement and cannot be directly compared in dB with Wi-Fi or BLE RSSI. That is why the Bluetooth Classic graphs use a relative scale (for example, -16 to -28) instead of typical dBm values: they do not represent the same physical quantity, and their values should not be compared number for number with the other two protocols. Only the trend between positions within Bluetooth Classic itself should be compared.
